TurnStyle
Well-known member
Okay, so maybe it's just me, but it annoys me looking at the ladder and having to factor in actual games played and byes had to get the "real" way it is being shaped.
The fixture is set so badly! We are about half way through the season and there are teams who've played 12, 13 and 14 games. A two game difference is huge and I think the ladder positions are warped because of it.
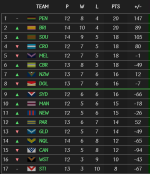
For example (using only the top two), Penrith is at the top of the table due to for and against, yet they've only played 12 games for their 20pts: 8 wins and 2 byes. Yet second placed Brisbane has played 14 games for 20pts: 10 wins, no byes.
So Brisbane is guaranteed another 4 points due to byes, whereas Penrith are not guaranteed to win both games they play on these Brisbane bye weeks.
I think that it would be more accurate to show the ladder in order of winning percentage (then for and against). It would be:
1. Brisbane P 14 W 10 L 4 B 0 Pts 20 Percentage 71%
2. Penrith P 12 W 8 L 4 B 2 Pts 20 Percentage 67%
I think it's a valid issue, as there could be instances such as a team being at the bottom even though they're only there because teams above them have had byes and they haven't yet.
It's deceptive, and people don't look at the ladder and think... anything other than where the teams are shown.
The only time in the entire season the ladder is completely accurate is when the very last game has been played.
Anyway... you get the point. Or 2 points if you've got the bye for this thread!
View attachment 5597
The fixture is set so badly! We are about half way through the season and there are teams who've played 12, 13 and 14 games. A two game difference is huge and I think the ladder positions are warped because of it.
For example (using only the top two), Penrith is at the top of the table due to for and against, yet they've only played 12 games for their 20pts: 8 wins and 2 byes. Yet second placed Brisbane has played 14 games for 20pts: 10 wins, no byes.
So Brisbane is guaranteed another 4 points due to byes, whereas Penrith are not guaranteed to win both games they play on these Brisbane bye weeks.
I think that it would be more accurate to show the ladder in order of winning percentage (then for and against). It would be:
1. Brisbane P 14 W 10 L 4 B 0 Pts 20 Percentage 71%
2. Penrith P 12 W 8 L 4 B 2 Pts 20 Percentage 67%
I think it's a valid issue, as there could be instances such as a team being at the bottom even though they're only there because teams above them have had byes and they haven't yet.
It's deceptive, and people don't look at the ladder and think... anything other than where the teams are shown.
The only time in the entire season the ladder is completely accurate is when the very last game has been played.
Anyway... you get the point. Or 2 points if you've got the bye for this thread!
View attachment 5597